

How to Study Density with Popcorn
by Christy McGuire, Contributor
Thanksgiving is almost here! You can use one of the original foods from the first Thanksgiving to discuss density with your students. Popcorn is fascinating because it changes so drastically during the cooking process. The color, shape and texture of a popped kernel are all different than those of an unpopped kernel. If you can spare the day before Thanksgiving break, this simple density experiment would be a great way to practice their inquiry skills, and a great excuse to have a treat in class!
If your students have already covered density, this is a great time to practice doing a full exploration complete with a written report. You might simply give them access to the relevant materials and set them loose with this challenge:
Find how density changes for popped verses upopped corn. Check the results of your experiment and write a description of your findings, including an error analysis.
If density is a new concept, or if your students are struggling to get the hang of the scientific method, you can help them figure out the procedure. Make them do as much of the thinking as possible though! Science is more fun for the engineer making the decisions than for the technician doing as he is told.
Leading questions to help students develop their procedures
How do we calculate density? (mass per volume)
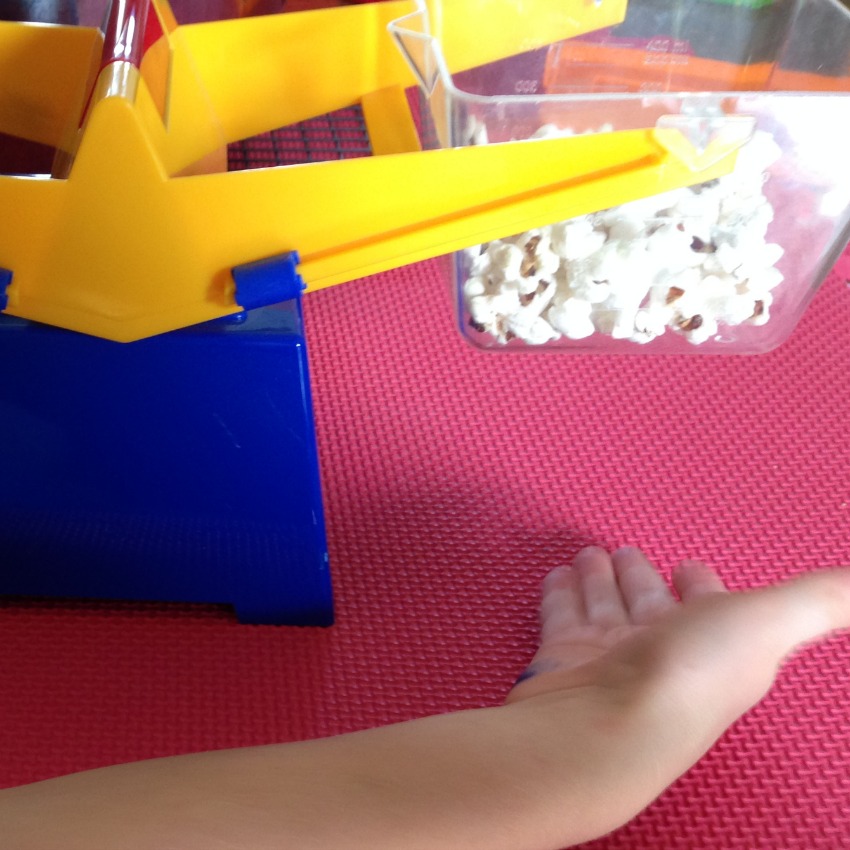
What measurements will we need to take in order to find density? (mass and volume)
How do we measure mass? How do we measure volume? (balance, and appropriate beakers)
How are we changing the popcorn? (popping method)
Hints for a successful experiment
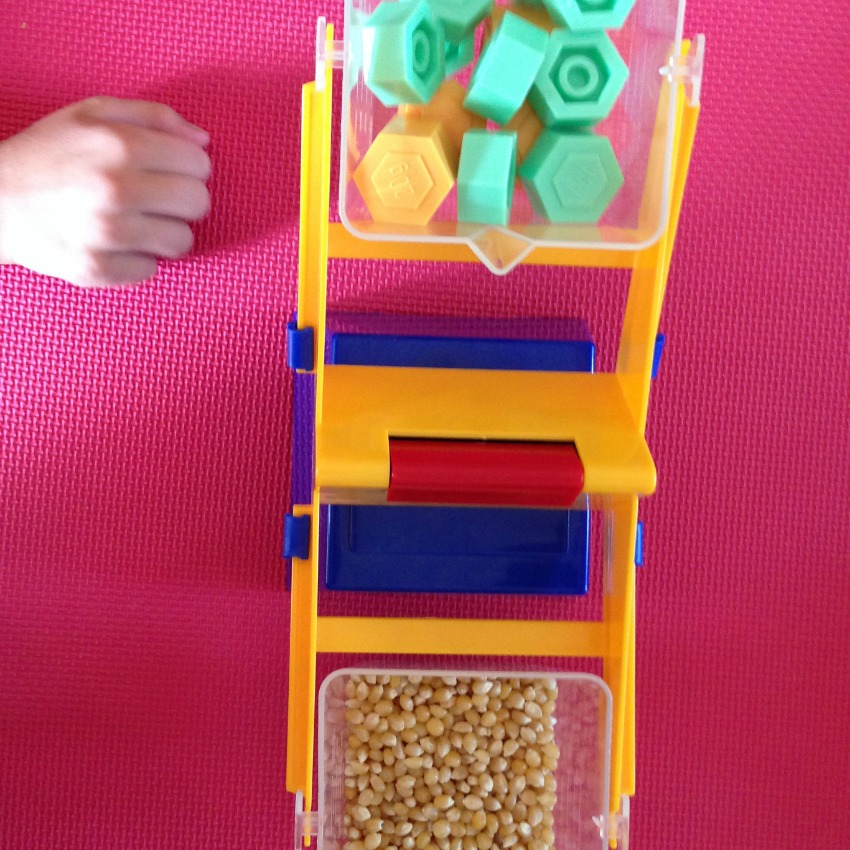
You can expect your popcorn to increase in volume by about 16X.
To pop the corn over heat, put a couple of tablespoons of oil in the pot or beaker, add corn and heat over medium heat.
If you are using a microwave, you can measure the volume of the popcorn in a bag of microwave popcorn and assume the same volume is in a second bag of popcorn that you pop before class.
Increase accuracy by repeating with varying quantities of popcorn, or by combining data from multiple lab groups.
Data Analysis
If you wish, you can have your students graph mass a function of volume for various amounts of unpopped corn, then do another graph for the popped corn. The slope of these graphs will be the density of the popcorn.
You can also ask your students to compute density algebraically, then graph density as a function of popped or unpopped.
Requiring students to analyze the accuracy of their results could provide some very interesting feedback. Lab groups could compare results with the rest of the class. They can also compare the initial and final masses and try to defend any changes that they find. My experience is that the mass of the popcorn actually increases during this experiment. Don’t tell your students! See what they can come up with to justify their own answers. Factors that they may want to consider include the mass and volume of the oil used to cook the kernels and the humidity on the day of the experiment.
No matter what your students’ level, this experiment can be adjusted to provide a challenging, and interesting exercise. I hope you will enjoy. Happy Thanksgiving!
Christy McGuire is a trained physics teacher who loves developing new ways for students to engage with science. While taking a break from the high school classroom, Christy rediscovered that young children are tons of fun, and can learn powerful science and math too. Now she is attempting to cross the excitement of early childhood style learning with serious STEM study to benefit students on both ends of the learning process. Find activities and reflections on STEM learning on her blog: www.ThrivingSTEM.com.

Leave a Reply
Want to join the discussion?Feel free to contribute!